


SUPPLY ANALYSIS
Meaning and Definition
Supply in economic does not refer to total stock or output of goods produced. It refers to only that portion of output that is offered for sale at a given price and time. For example, if a farmer produces 100 tubers of yam and consumes 40 tubers, gives out 20 tubers as gift to friends, sends the remaining 40 for sale, then the supply of yam will be 40. Supply is therefore defined as the various quantities of a commodity that firms/producers/suppliers are willing and able to sellat a given prices over a specific period of time. There is a clear distinction between supply and production, thus quantity supplied is not the same as or equal to quantity produced.
Supply shows the relationship between price and the quantity supplied of a certain commodity over a period of time. Whilst quantity supplied is the total number of units of goods sold at a certain price.
The Law of Supply
The law of supply states that ceteris paribus (other things being equal), the higher the price of a commodity, the greater the quantity supplied of it and the lower the price, the smaller the quantity supplied. The law of supply establishes a direct relationship between price and supply, the reason for this is mainly because sellers usually aim at maximizing profit. Firms will only offer for sale if the market price covers the opportunity cost of producing the goods. The assumption of supply can be illustrated on a supply schedule, curve and equation.
The Supply Schedule:
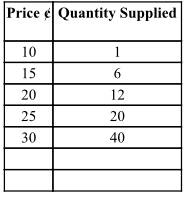
A supply schedule is a hypothetical data or table that shows the amount of goods and services that a firm/producer is willing and able to produce at a given price over a given period of time. An example of a supply schedule is shown below. The schedule shows that at higher prices quantity supplied increases while it decreases at lower prices. Just like demand, we can have individual and market or total supply schedules for a commodity.
A supply Schedule

Individual supply schedule is a table that shows the amount of goods and services that a producer is willing and able to offer for sale at a given price over a specific period of time. That is, it is a table that shows prices and quantities of a given commodity offered for sale by an individual seller or producer. The table above is an example of individual supply schedule. The market supply schedule is a horizontal summation of all the individual supply schedules for a specific commodity. It is a table that shows the summation or aggregation of goods and services in which different producers of a particular good or service are willing and able to supply (sell) in a market at different prices over a given period of time.
Market Supply Schedule
Price GH¢ | Producer (A) | Producer (B) | Market Demand Schedule (A +B) |
23 | 300 | 350 | 650 |
19 | 220 | 200 | 420 |
13 | 100 | 100 | 200 |
9 | 50 | 50 | 100 |
4 | 10 | 10 | 30 |
From the above market supply schedule, when the price was low producers in the market produces less and as price increases, quantity supply increases. The horizontal summation of Producer A and Producer B individual supply schedules at the prevailing market price produced the market supply schedule which shows that more is offered for sale when the price is high and less is offered for sale when the price is low over the specified time period, ceteris paribus (holding other factors constant).
Supply Curve
This is a graphical representation of a supply schedule. We get the supply curve by plotting the supply schedule graphically. It is a graph that shows the amount that producers are willing and able to supply at a particular price. We can as well have individual supply curve for a commodity and a market or total supply curve for a commodity. These follow the same procedure as shown in the case of demand. Assuming we plot the above supply schedule, the resulting curve will look like shown below
Supply Curve.

A study of the above diagram shows that, at a higher price,, a greater quantity,
, is supplied. But at a lower price,
a smaller quantity
is supplied. Producers will supply more at higher prices because as supply increases cost of production also increases. Also, to compensate for the high cost of production he must sell at higher price.
No comments yet
Be the first to share your thoughts!